Registering your devices
A device only shows up in Devices once it's been registered. Registration happens automatically the first time an admin logs a user in on that device and gives it a name. After that, its name will show up for every session on that device going forward, no matter which user uses it.
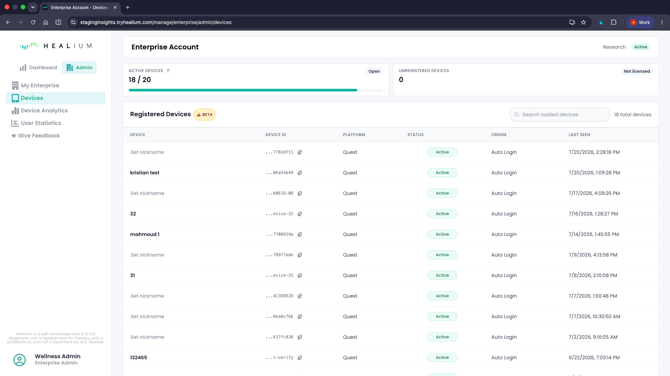
A few things worth knowing:
- You can name a device anything that helps you tell your goggles apart.
- Registered Devices is the count of devices currently registered to your account
- Unregistered Devices are devices that were registered before but have since been unregistered, and aren't currently in use.
- Only admins can register or unregister a device.
What is device analytics?
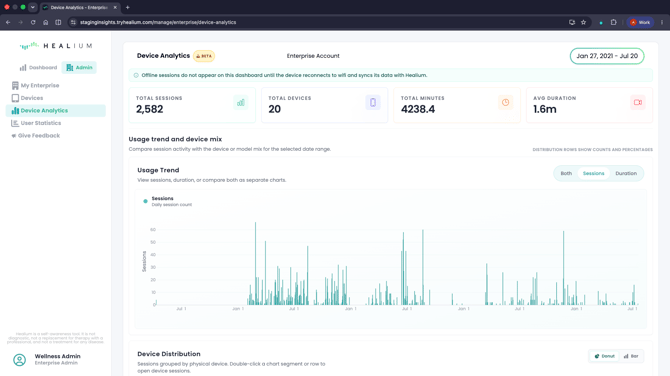
Device Analytics is where you can track session activity across all the devices registered to your account. It shows you how many sessions have happened, how long they lasted, and which devices were used all in one place. You'll find it in the left-hand menu, right below Devices. A date range selector at the top lets you control which sessions the whole page reflects.
Your summary numbers
At the top of the page, you'll see four numbers that give you a quick snapshot of activity for your selected date range:
- Total Sessions – the total number of sessions your users have completed
- Total Devices – how many devices were used for those sessions
- Total Minutes – the combined number of minutes across all sessions
- Avg Duration – the average length of a session
Usage Trend
This shows you session activity over time. You can view it three ways:
- Sessions – a daily count of how many sessions happened
- Duration – how long sessions lasted over time
- Both – sessions and duration shown together
Note: Offline sessions won't show up right away. They'll appear once the device reconnects to WiFi and syncs its data with Healium.
Device Distribution
This section shows you how sessions are spread out across your devices — helpful if you want to see which device is getting more use than the others.
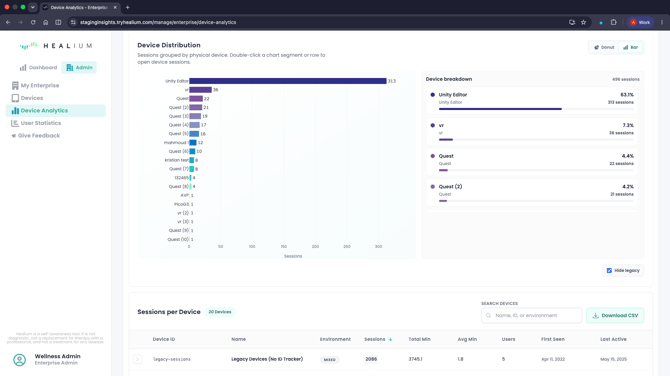
You can view this as a donut chart or a bar chart. Next to the chart, the device breakdown list shows each device's name, its percentage of total sessions, and how many sessions it had. Double-clicking a chart segment or a row in the breakdown will take you to that device's sessions.
Sessions per Device
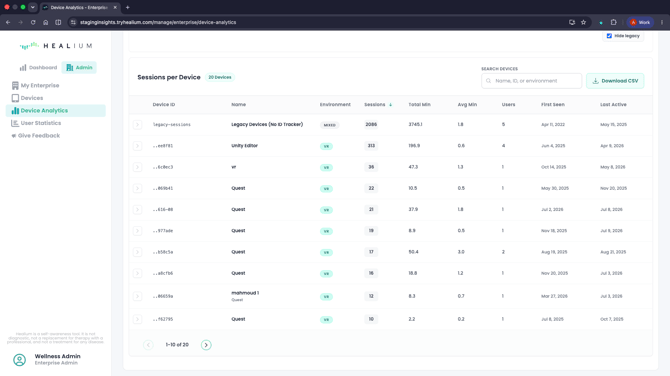
This table gives you the full picture for each device, and backs up what you see in the Device Distribution chart above it. To view these sessions, you'll find a  button to the left side of each device ID. For each device, you'll see:
- Device ID
- Device Name
- Environment
- Number of sessions
- Total minutes
- Average minutes per session
- Number of users
- First seen date
- Last active date
You can search this table by device name, ID, or environment, and you can download the full table as a CSV file using the Download CSV button.
What's next
Now that you know how Device Registration and Device Analytics work, you can use it to keep an eye on how your devices are being used and spot any devices that need more — or less — attention.